3.1. Geodetic survey. Plan, Map, Profile
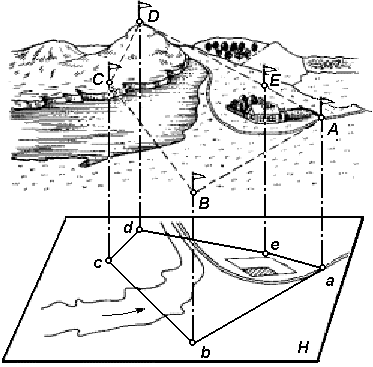
To project a terrain line on a horizontal plane, you need to determine its horizontal distance (the projection of the line on a horizontal plane) and reduce it to a certain scale. To project on a horizontal plane of a polygon (Fig. 26), measure the distance between its vertices and the horizontal projections of its angles.
The combination of linear and angular measurements on the earth's surface is called a geodetic survey . According to the results of geodetic surveys make a plan or a map.
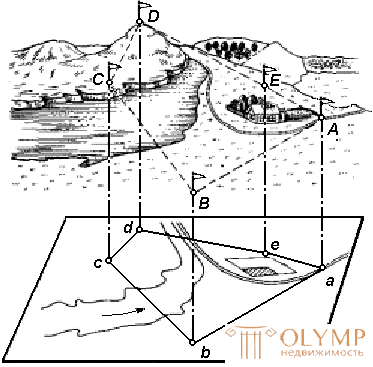
Fig. 26. Designing a section of the earth's surface on a horizontal plane
Plan - a drawing in which a horizontal projection of a small portion of a terrain is depicted in a reduced and similar form.
Map - a reduced and distorted image of a cartographic projection of a significant part or all of the earth's surface, built according to certain mathematical laws that take into account the influence of the curvature of the Earth.
Thus, both the plan and the map are thumbnail images of the earth's surface on a plane. The difference between them is that when mapping a design, the design is made with surface distortions due to the influence of the curvature of the Earth; an image is obtained on the plan with little or no distortion.
Depending on the destination plans and maps can be contour and topographic. On contour plans and maps, conventional signs depict a situation, i.e. only the outlines (outlines) of horizontal projections of local objects (roads, buildings, arable lands, meadows, forests, etc.).
On topographic maps and plans, in addition to the situation, the terrain is depicted.
For the design of railways, highways, canals, highways, water pipes and other structures it is necessary to have a vertical section or profile of the terrain.
A terrain profile is a drawing in which a section is shown in a reduced form by a vertical plane of the Earth's surface in a given direction.
As a rule, the terrain cut (Fig. 27a) is a curved ABC ... G line . On the profile (fig. 27, b) it is constructed in the form of a broken line abc ... g . The level surface is depicted as a straight line. For greater clarity, the vertical segments (heights, elevations) make larger than horizontal ones (distances between points).

Fig. 27. Vertical section (a) and terrain profile (b)
3.2. Relief. Basic landforms
Relief is a form of the physical surface of the Earth, viewed in relation to its level surface.
A relief is a collection of irregularities of the land, the bottom of the oceans and seas, varied in shape, size, origin, age, and developmental history. When designing and building iron, automobile and other networks, it is necessary to take into account the nature of the relief — mountain, hilly, flat, etc.
The relief of the earth's surface is very diverse, but the whole variety of relief forms to simplify its analysis is typed into a small number of basic forms (Fig. 29).
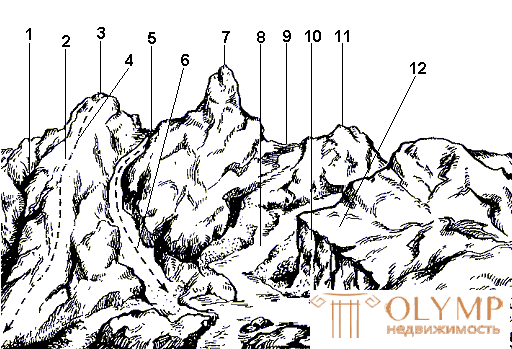
Fig. 29. Landforms:
1 - hollow; 2 - ridge; 3, 7, 11 - the mountain; 4 - watershed; 5, 9 - saddle; 6 - thalweg; 8 - the river; 10 - break; 12 - terrace
The main forms of relief include:
The mountain is a cone-shaped relief elevated above the surrounding terrain. Its highest point is called the top. The peak can be sharp - peak, or in the form of a platform - plateau. The side surface consists of ramps. The line of fusion of stingrays with the surrounding terrain is called the bottom or bottom of the mountain.
The hollow is a relief form, the opposite mountain, representing a closed recess. Its lowest point is the bottom. The side surface consists of slopes; the line of their confluence with the surrounding terrain is called the border.
The ridge is a hill extended and constantly falling in any direction. The ridge has two slopes; in the upper part of the ridge, they merge to form a watershed line, or watershed.
The hollow is a form of relief, opposite to the ridge and representing a constantly decreasing recess stretched in any direction and open from one end. Two ramp slopes; merging with each other in the lowest part of it, they form a spillway line or a thalweg, along which the water falling on the slopes flows. The valley and the ravine are varieties of the ravine: the first is a wide ravine with gently sloping, sodded grasslands, the second is a narrow ravine with steep exposed ramps. The valley is often a bed of a river or stream.
A saddle is a place that forms when the slopes of two neighboring mountains merge. Sometimes the saddle is the confluence of the watersheds of the two ridges. From the saddle originate two hollows, extending in opposite directions. In mountainous areas, roads or hiking trails usually run through saddles; therefore, saddles in the mountains are called passes.
3.3. The relief image on plans and maps
To solve engineering problems, the image of the relief should provide: first, a quick determination with the required accuracy of the heights of the terrain points, the direction of the steepness of the slopes and the slopes of the lines; secondly, a visual display of the actual landscape of the area.
The terrain on the plans and maps are depicted in various ways (hatching, dotted, color plastic), but most often with the help of contours (isohypsum), numerical marks and conventional signs.
The horizontal on the ground can be represented as a trace formed by the intersection of the level surface with the physical surface of the Earth. For example, if you imagine a hill surrounded by still water, then the coastline of water is horizontal (Fig. 30). The points lying on it have the same height.
Assume that the height of the water level relative to the level surface is 110 m (Fig. 30). Suppose now that the water level fell by 5 m and part of the hill was exposed. The curved line of intersection of the water and the hill will correspond to the horizontal with a height of 105 m. If you consistently reduce the water level by 5 m and project the curved lines formed by the intersection of the water surface with the earth's surface, on a horizontal plane in a reduced form, then you will get an image of the terrain horizontals on plane.
Thus, the curved line connecting all points of the terrain with equal marks is called the horizontal .
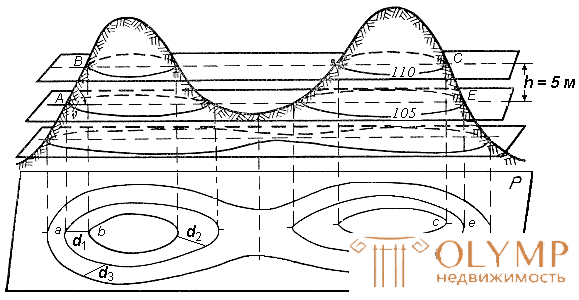
Fig. 30. The method of image relief contour
When solving a number of engineering problems, it is necessary to know the properties of contour lines:
1. All terrain points lying on the horizontal line have equal marks.
2. Horizontals can not intersect on the plan, because they lie at different heights. Exceptions are possible in mountainous areas, when the contours depict an impending cliff.
3. Contours are continuous lines. Contour lines interrupted by the plan frame are closed outside the plan.
4. The distance between adjacent horizontal cutting planes h (see Fig. 30) is called the height of the cross section of the relief . It is equal to the height difference of two adjacent horizontals.
The height of the relief section within the plan or map is strictly constant. Her choice depends on the nature of the terrain, scale and destination map or plan. To determine the height of the cross section of the relief sometimes use the formula
h = 0.2 mm · M,
where M is the denominator of the scale.
This height of the cross section of the relief is called normal.
5. The distance between adjacent contour lines on a plan or map is called the laying of a slope or slope . A pitch is any distance between adjacent horizontals (see Fig. 30); it characterizes the steepness of the slope of the terrain and is denoted by d .
The vertical angle formed by the direction of the slope with the plane of the horizon and expressed in angular measure is called the slope angle of the slope ν (Fig. 31). The greater the angle of inclination, the steeper the slope.

Fig. 31. Determination of slope and slope angle
Another characteristic of slope is slope i . The slope of the terrain line is the ratio of elevation to horizontal distance. It follows from the formula (Fig. 31) that the slope is a dimensionless quantity. It is expressed in hundredths (%) or thousandths - ppm (‰).
If the angle of inclination of the slope is up to 45 °, then it is represented by contours, if its steepness is more than 45 °, then the relief is designated by special signs. For example, a break is shown on the plans and maps with the corresponding conventional sign (Fig. 32).
The image of the main landforms contour contours is shown in Fig. 32.
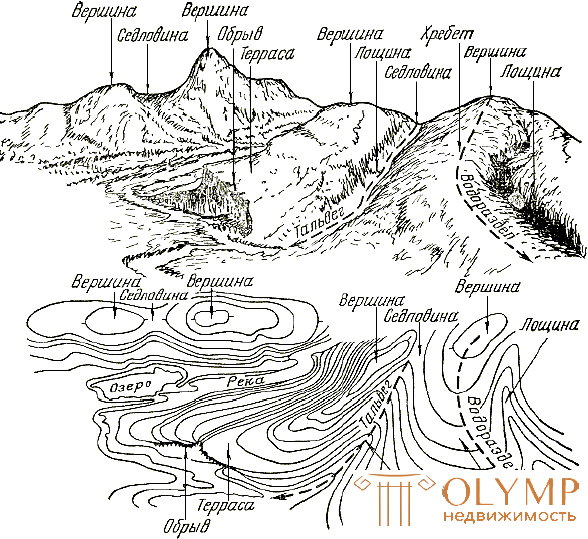
Fig. 32. The image of relief forms by contour lines.
For the image of the contour with contour lines, a topographical survey of the terrain is performed. The results of the survey determine the coordinates (two planned and height) for the characteristic points of the relief and put them on the plan (Fig. 33). Depending on the nature of the relief, scale and purpose of the plan, choose the height of the section of the relief h .
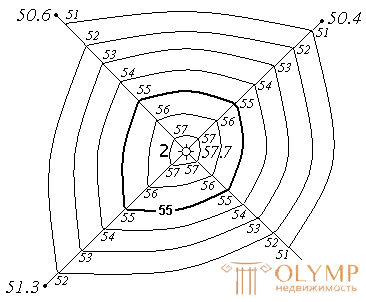
Fig. 33. Relief image contour
For engineering design, usually h = 1 m. Contour marks in this case will be a multiple of one meter.
The position of the contour lines on the plan or map is determined by interpolation. In fig. 33 shows the construction of contours with marks 51, 52, 53, 54, 55, 56, 57 m. Horizontals multiples of 5 or 10 m are thickened on the drawing and signed. Signatures are applied in such a way that the top of the numbers indicate the direction of elevation of the relief. In fig. 33 signed horizontal with a mark of 55 m.
Where there is more laying, dashed lines ( half horizontal ) are applied. Sometimes, in order to make the drawing more visual, the horizontal lines are accompanied by small lines, which are perpendicular to the horizontal lines, in the direction of the slope (towards the water flow). These dashes are called bergshtri .
3.4. Tasks solved on plans and maps
3.4.1. Determination of terrain points by horizontals
a) The point lies on the horizontal .
In this case, the point mark is equal to the horizontal mark (see fig. 35): HA = 75 m ; NS = 55 m .
b) The point lies on the slope between the contours .
If a point lies between the contours, then a shortest inlay is made through it, the length of segments a and b is measured with a scale bar (see Fig. 35, point B ) and substituted into the expression

where h is the height of the cross section of the relief. If the point lies between the horizontal and the semi-horizontal, then instead of h , 0.5h is substituted into the formula.
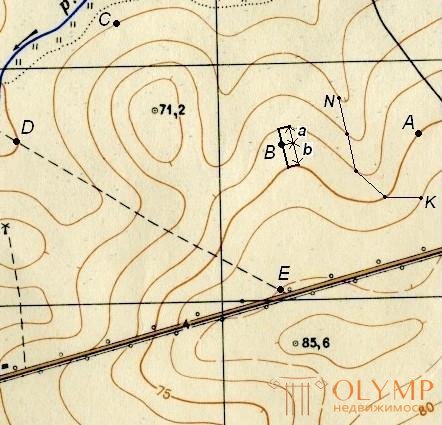
Fig. 35. Solving problems on a map with contours
3.4.2. Determination of the slope
The slope of the slope in the direction of the inception is determined by two indicators - slope and angle of slope by the formula

Therefore, the slope of the line to the horizon is called its slope. Bias is expressed in thousandths - ppm (‰) or as a percentage (%). For example: i = 0.020 = 20 = 2%.
To graphically determine the angles of inclination for a given embedding value d , scale M and height of the cross section of the relief h, a plot of plots is plotted (see Fig. 36).
The points corresponding to the values of the angles of inclination are plotted along the straight line of the base of the graph. From these points, perpendicular to the base of the graph, lay at the scale of the map segments that are equal to the corresponding deposits, namely

The ends of these segments are joined by a smooth curve (see Fig. 36).
The laying of the line, the angle of which is to be determined, is removed from the map using a meter, and then, laying down the measured segment on the graph between the base and the curve, find the corresponding value of the angle of inclination.
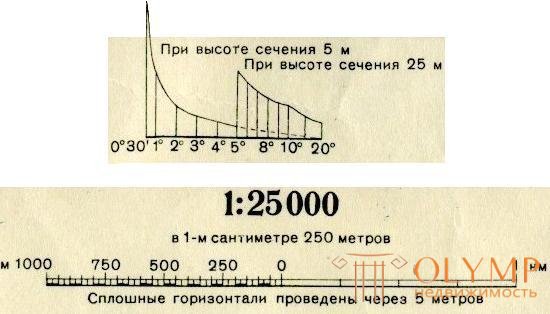
Fig. 36. Plotting schedule for tilt angles
Similarly, build and use the schedule of pledges for slopes (Fig. 37).
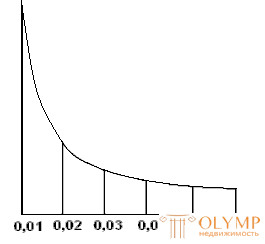
Fig. 37. Schedule of pledges for slopes
3.4.3. Creation of a line with a given slope
The task of building a line with a given slope is solved in the design of routes of iron, road and other linear structures. It lies in the fact that from a certain point indicated on the map, it is necessary to draw a line with a given inclination i in a given direction. To do this, first determine the value of the d , corresponding to the given i and h . It is found on the basis of the slope or calculated by the formula
d = h / i .
Next, setting the meter solution equal to the obtained value of d , put one of its legs to the starting point K , and the other mark the nearest horizontal and, thus, mark the point of the route from which they in turn trace the next horizontal, etc. (see fig. 38).
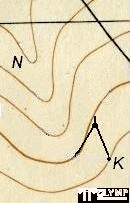
Fig. 38. Construction of a line with a given slope
3.4.4. Building a profile using a topographic map
The terrain profile is a reduced image of a vertical section of the terrain in a given direction.
Suppose you want to build a terrain profile along the line DE indicated on the map (Fig. 39). To build a profile on a sheet of paper (usually using graph paper) draw a horizontal line and on it, usually at the scale of the map (plan), lay the DE line and its points of intersection with horizontals and hemispheres. Further from these points along the perpendiculars lay the marks of the corresponding contour lines (in Fig. 39 these are marks of 50, 55, 60, 65, 70, 75, 80 and 82.5 m). To display a profile more prominently, point marks are usually set aside at a scale 10 times larger than the scale of the plan. Connecting the straight ends of the perpendiculars, get a profile along the line DE .
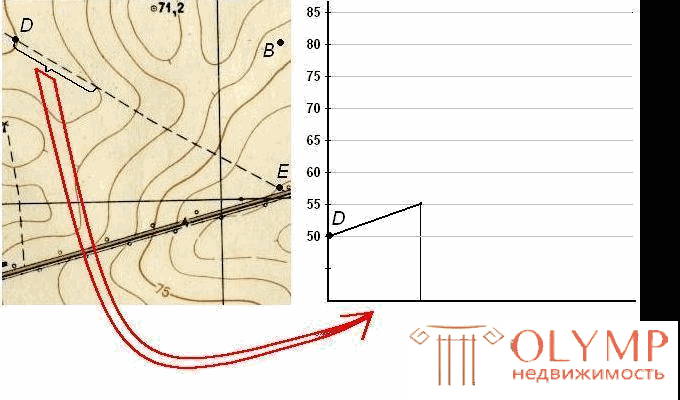
Fig. 38. Building a profile using a topographic map
3.5. Questions for self-control
1. What is meant by terrain?
2. What are the shape of the relief.
3. What is the horizontal? What are its main properties?
4. What is the height of the cross section of the relief?
5. What is the formation of horizontals?
6. What is the slope of the line?
7. How is the normal height of the cross section of the relief?
8. How to determine on the map the height of the point and the slope of the slope?
9. What is a digital terrain model and an electronic map?
10. What baseline data is needed to create digital terrain models?
11. How are digital terrain models classified according to the method of placing initial information and the rules for its processing on a computer?
Что бы оставить комментарий войдите
Комментарии (0)